Introduction
Chrome DevTools guide is essential for developers who want to master frontend debugging. It helps you inspect, debug, and optimize your web applications efficiently.
In this guide, we will explore how to use Chrome DevTools for frontend debugging like a pro.
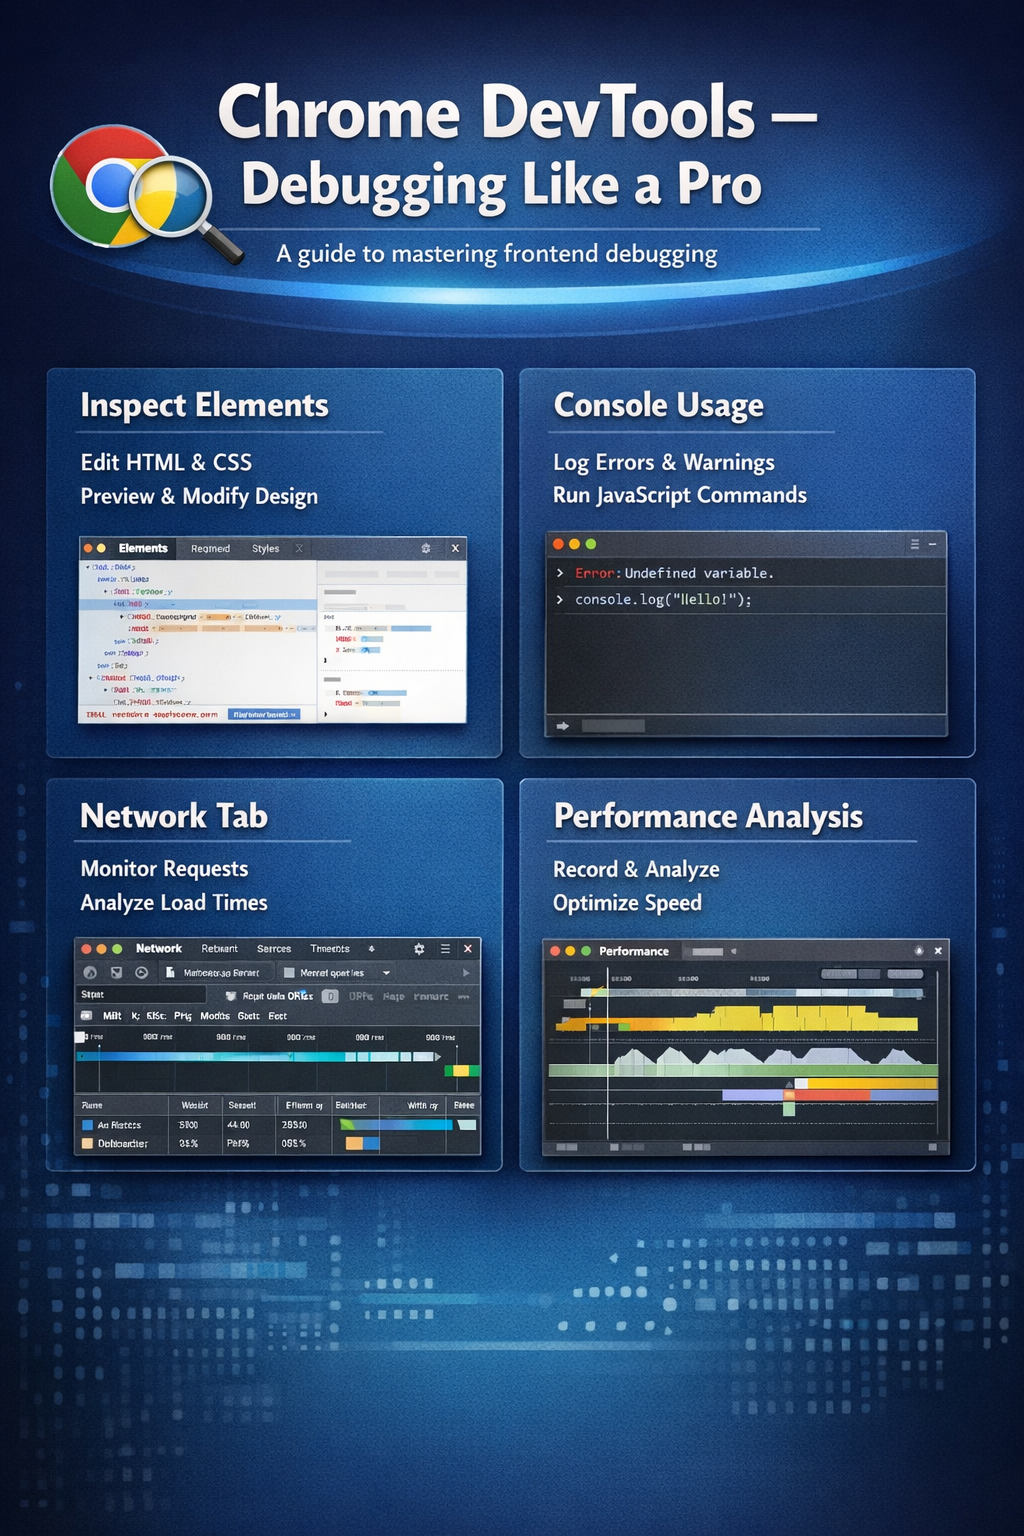
1. Inspect Elements
Inspect element is one of the most powerful features.
What You Can Do:
- View HTML structure
- Modify CSS in real-time
- Debug layout issues
Tip:
Use it to quickly test UI changes without editing code.
2. Console Usage
Console helps you debug JavaScript.
Uses:
- Log outputs
- Check errors
- Run JavaScript code
Tip:
Use console.log() to track values and debug logic.
3. Network Tab
Network tab helps analyze requests.
What to Check:
- API calls
- Load time
- Status codes
Tip:
Use it to debug slow loading issues.
4. Performance Analysis
Performance tab helps optimize your app.
What to Analyze:
- Page load time
- Rendering issues
- Memory usage
Tip:
Optimize resources for better performance.
Conclusion
Chrome DevTools guide is a must for frontend developers. It helps in debugging, testing, and optimizing applications efficiently.
Call to Action
Start using Chrome DevTools today and improve your frontend debugging skills.