


Data Distributions for Data Science
Introduction
Data distributions are important in statistics and data science. In this data distributions for data science for beginners free, you will learn how data is spread and how it helps in analysis. Understanding distributions is useful for making better decisions from data.
What are Data Distributions
A data distribution shows how values are spread in a dataset. It helps in understanding patterns, trends, and variations in data.
Types of Data Distributions
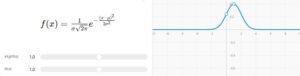
Normal Distribution
A normal distribution is a symmetric distribution where most values are around the mean. It is also called a bell-shaped curve.
Skewed Distribution
In a skewed distribution, data is not evenly spread.
Positive Skew
Tail is on the right side.
Negative Skew
Tail is on the left side.
Uniform Distribution
In a uniform distribution, all values have equal probability.
Normal Distribution Formula
Visualizing Distribution in Python
import seaborn as sns
import matplotlib.pyplot as plt
import matplotlib.pyplot as plt
data = [10, 20, 20, 30, 40, 50]
sns.histplot(data, kde=True)
plt.show()
Importance of Data Distributions
Data distributions help in understanding the nature of data. They are useful in selecting the right statistical methods and machine learning models.
Applications in Data Science
Distributions are used in data analysis, probability, and predictive modeling. Many machine learning algorithms assume normal distribution.
Internal Learning Links
Continue your learning journey:
- Click here: Data Science course for free
Conclusion
This data distributions for data science for beginners free lesson helps you understand how data is distributed. It is an important concept for analyzing and modeling data effectively.